Debugging and optimization
Debugging
Global Errors
Out of Memory
If you encounter a white screen with the following error instead of loading the page:
Allowed memory size of 268435456 bytes exhausted (tried to allocate 20480 bytes)
Increase the memory limit for PHP on the server. This error occurs when there is not enough memory to perform the current operation, including opening a table.
If you are opening a very large table, try limiting the number of rows to be displayed using a prefilter or pages.
In some cases, this same error can be caused by an infinite loop in the codes. See the next section.
Deadly Table Loop
Sometimes codes in fields can lead to an eternal loop of the table, consuming all available memory or exhausting the recursion stack in PHP. In the first case, an error will occur as described above, in the second case, there may be a server error or a white screen.
For example: code in any header field like:
=: recalculate(table: $#ntn)
This will lead to guaranteed table malfunction. In this case, it will not be possible to open the table in the usual way.
To fix such situations, you can open the field settings through table composition by navigating to System Tables — Main — Tables and Fields — Table Composition and filter the fields by the table you need.
Field settings are stored in the Field Parameters field.
Script Execution Time Error
If the execution of a change in the table or action was stopped due to the maximum script execution time, increase the available execution time for Totum:
You can override it in Conf.php in the root folder of the installation with the parameter:
public static $timeLimit = 120; // in seconds, default is 2 minutes
To open Conf.php for editing, execute:
nano /home/totum/totum-mit/Conf.php
Maximum File Size Uploadable to File Field
If you encounter an issue where a file does not upload to the file field, check the upload_max_filesize and post_maxsize parameters on the server.
Open the fpm pool settings:
nano /etc/php/8.3/fpm/pool.d/totum.conf
Parameter:
php_admin_value[upload_max_filesize] = 10M
Open the nginx settings:
nano /etc/nginx/sites-available/totum.online.conf
Parameter:
client_max_body_size 10M;
Restart fpm and nginx:
service php8.3-fpm restart && service nginx restart
UTF Content Output Error or Too Large Data Packet
It is possible that logging is enabled (in the upper right corner of the screen) and the logs are too large to display. Open any other table and disable the logs.
You may be trying to load a table that is too large. Enable pages for it by opening the settings from System Tables — Main — Tables and Fields — Table List.
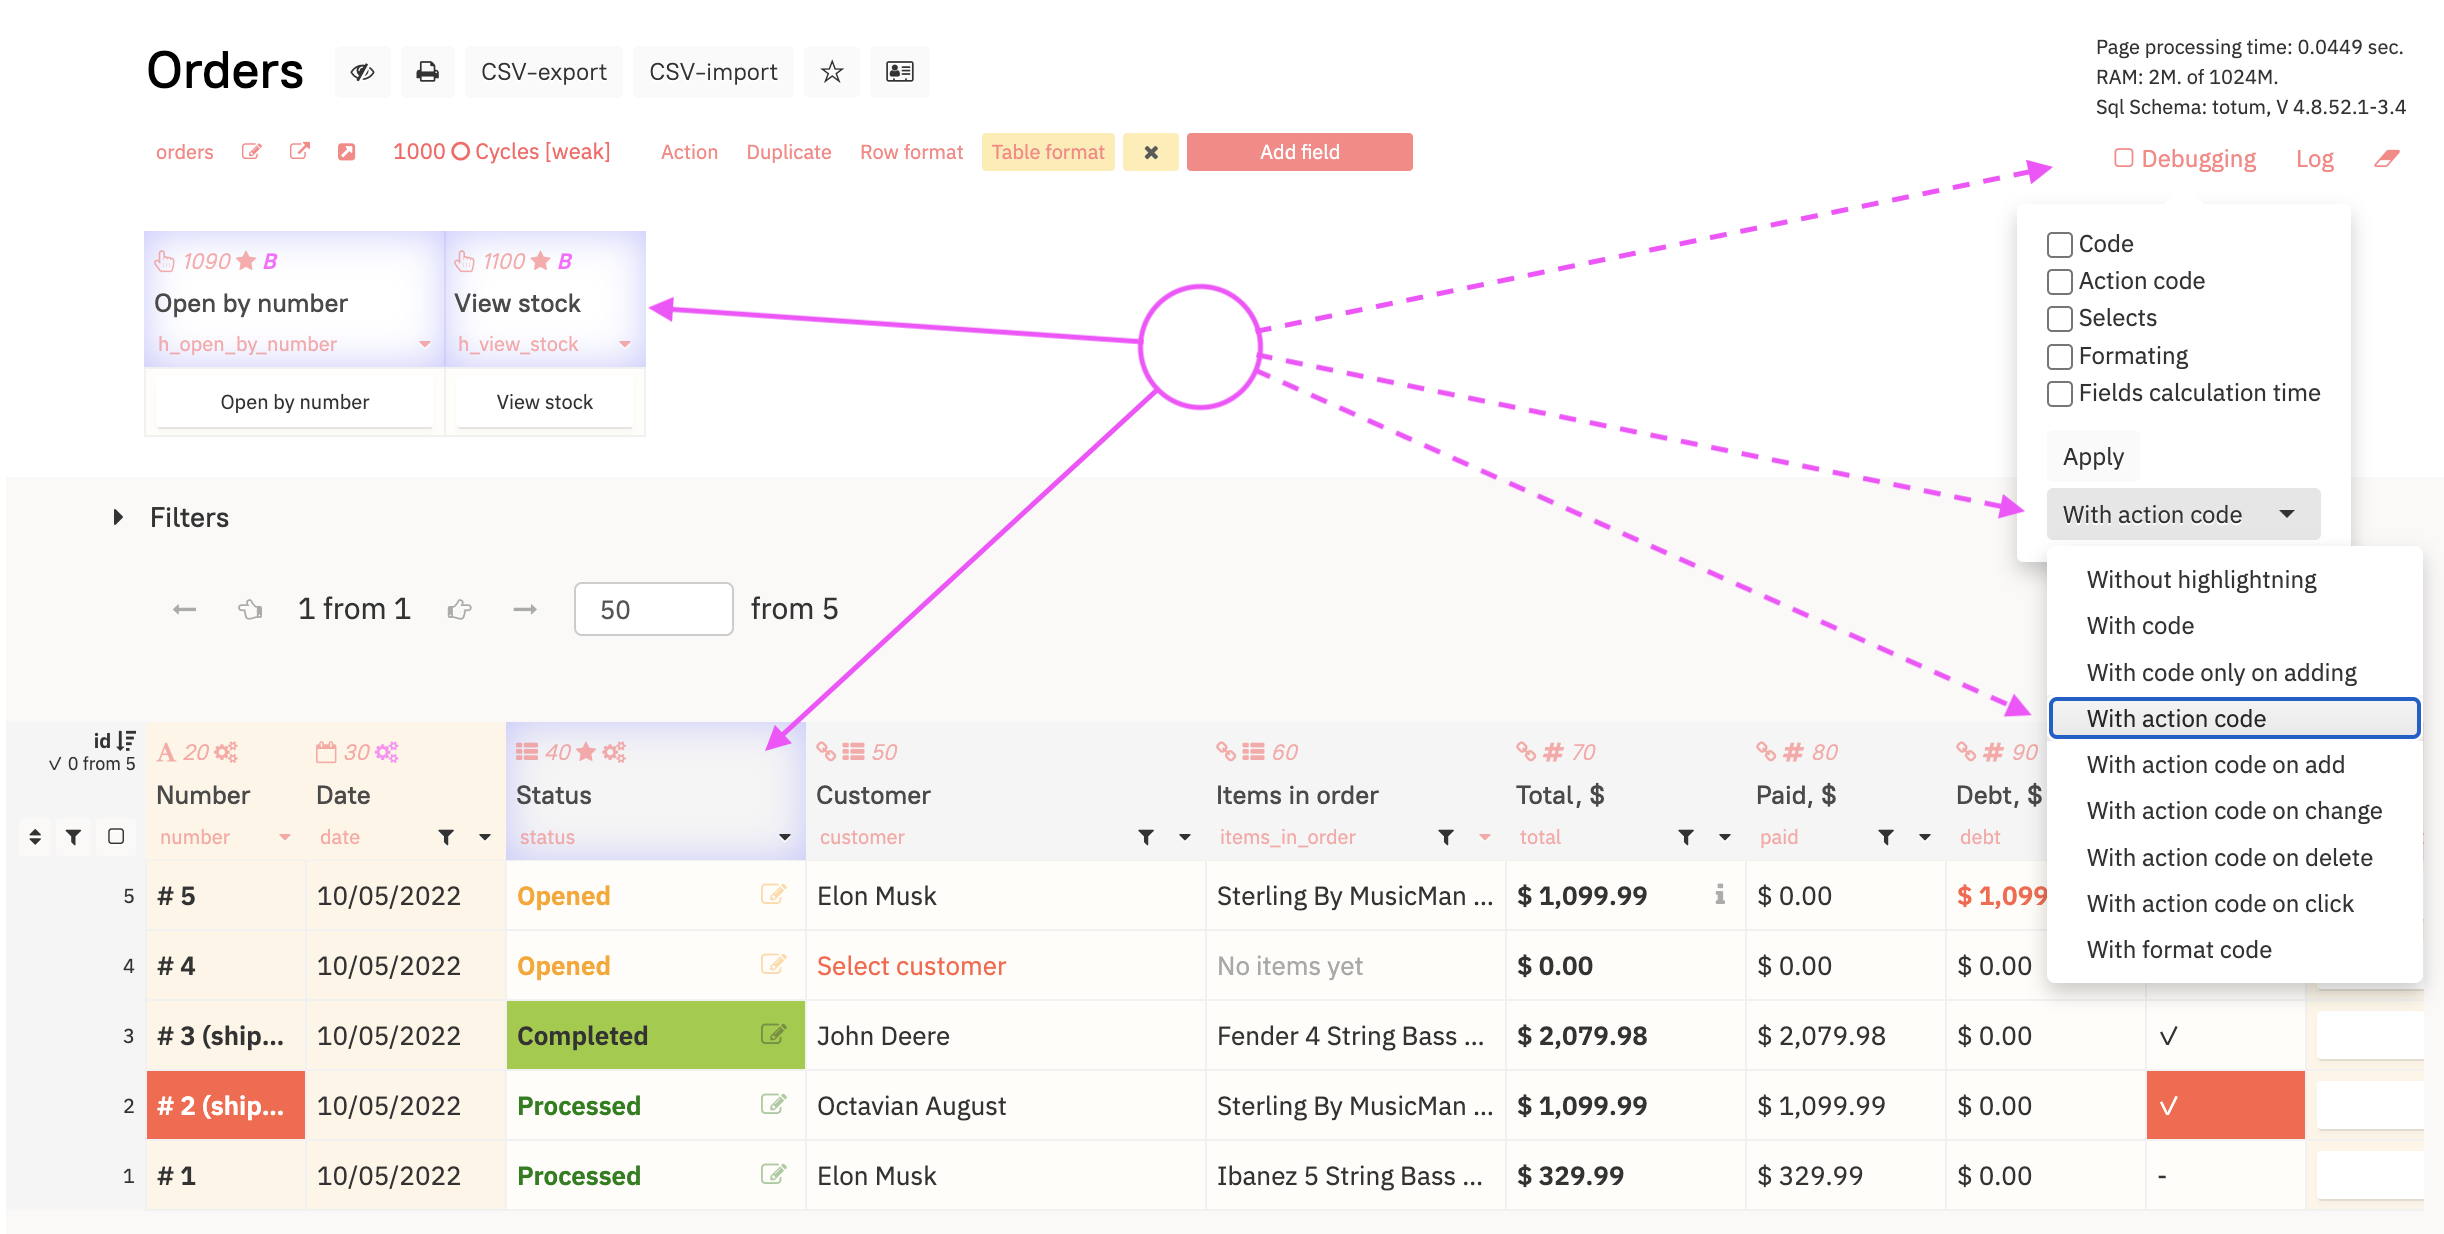
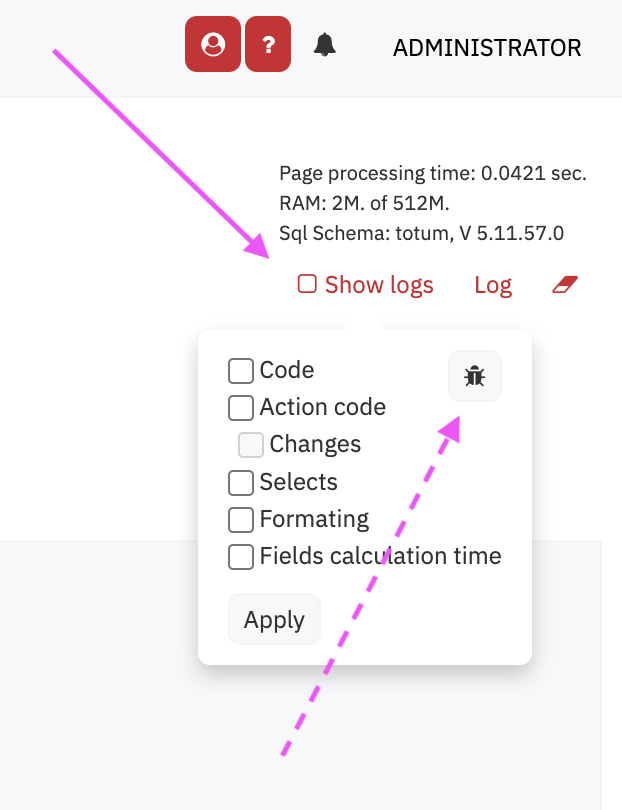
Enabling Debugging
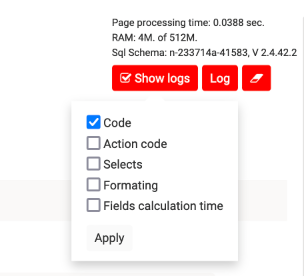
Logs consume a significant amount of server power and are transmitted to the browser along with the page content. Therefore, their enabling is divided into sections:
Code — tracking the field value calculation section.
Action Code — tracking the action execution section.
Selects — tracking the select display calculation section.
Formatting — tracking the formatting section.
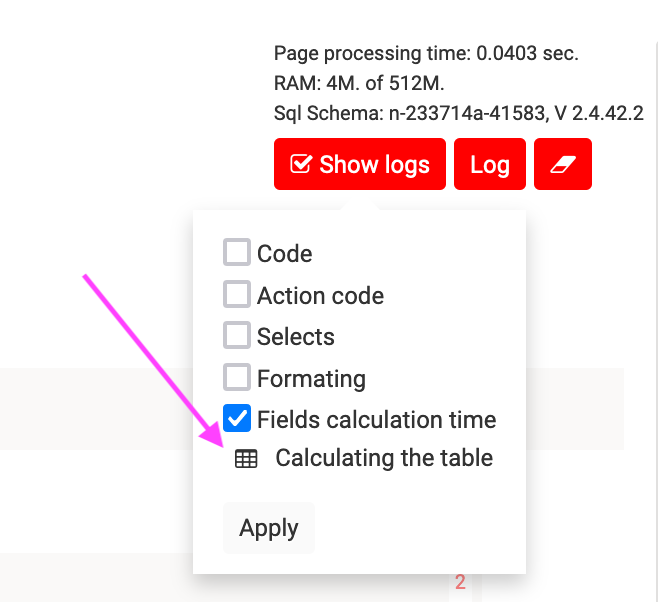
Recalculations and selects— deprecated, disabled.Field calculation time— records the field calculation time across various code sections for optimizing the performance of large tables. The result is called by clicking on the table icon next to the checkmark after updating the table.
It is recommended to enable no more than two at the same time! After enabling the log, you need to perform the target action for recording.
Calculation logs are not stored anywhere; they are delivered to the web interface along with the table when the table is changed.
Logs are available via the Log button in the upper right corner of the table. To view logs for a specific cell, you can call the debug window from the panel by right-clicking.
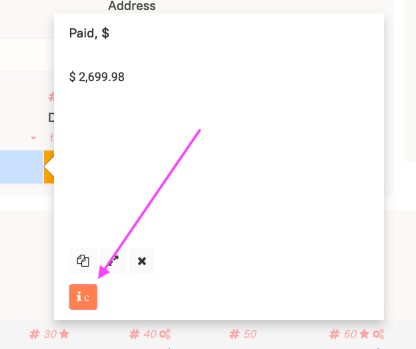
ic— only the code section.ia— only the action code section.if— only the formatting section.is— only the code-select section.
PRO field highlighting
In the PRO version, you can highlight field headers for quick search of the required type of code used in the table fields.
Reading Debug Logs
In the log, you can see the sequence of code execution lines, their results, input parameters, and used variables. You can also determine at which stage an error occurred. The error bubbles up to the launch line of code.
Access via Log Button
When accessing logs through the Log button, fields are separated by placements. Inside the row part, addressing is done by the id of the row.
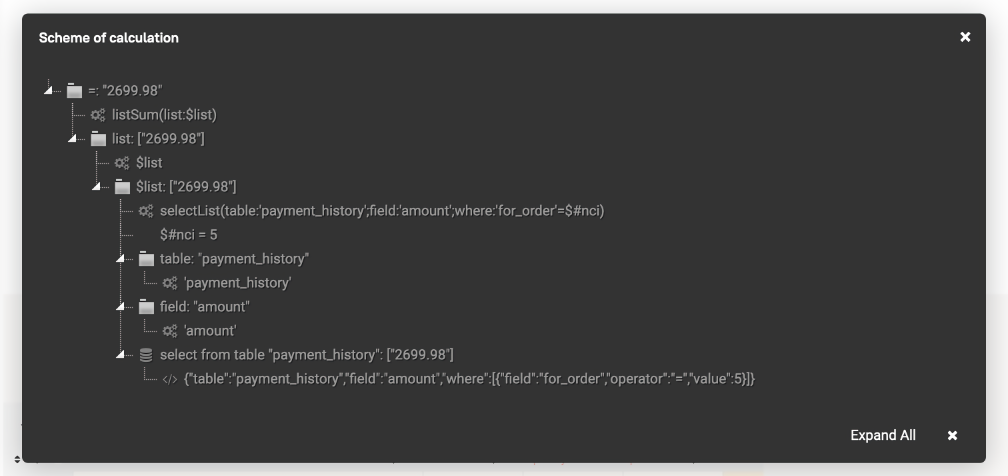
Designations:
Cog (gears)— code section.Wand (magic wand)— element.Hand— indicates a code section calculated and fixed in the previous operation.</> (fraction)— output of list values.HDD (disks)— database query.
Clicking on an element will expand it in a pop-up window.
When an error occurs, it can be traced back to the point of occurrence.
Field Calculation Time
Used for debugging performance and load.
Enable — Reload — Open:
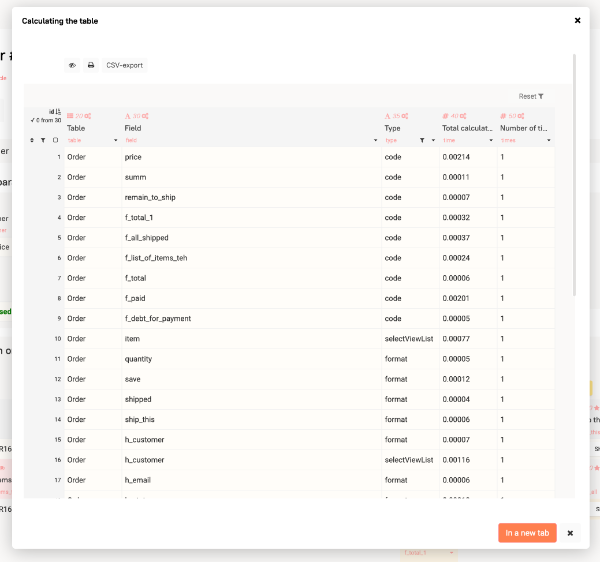
table— the table in which the field code execution time is measured.field— name of the fields.type— type of operation execution:calc— execution of code.format— calculation of formatting.
time— total execution time of codes by type in this field in seconds.times— the number of times the code was executed. For header and footer for the field, this will be 1 time, for the row part — by the number of rows.
Finding the Error Field
If the table does not open and you do not know which field contains the error, you can try to find it by searching.
In Debug, open the error search tool:
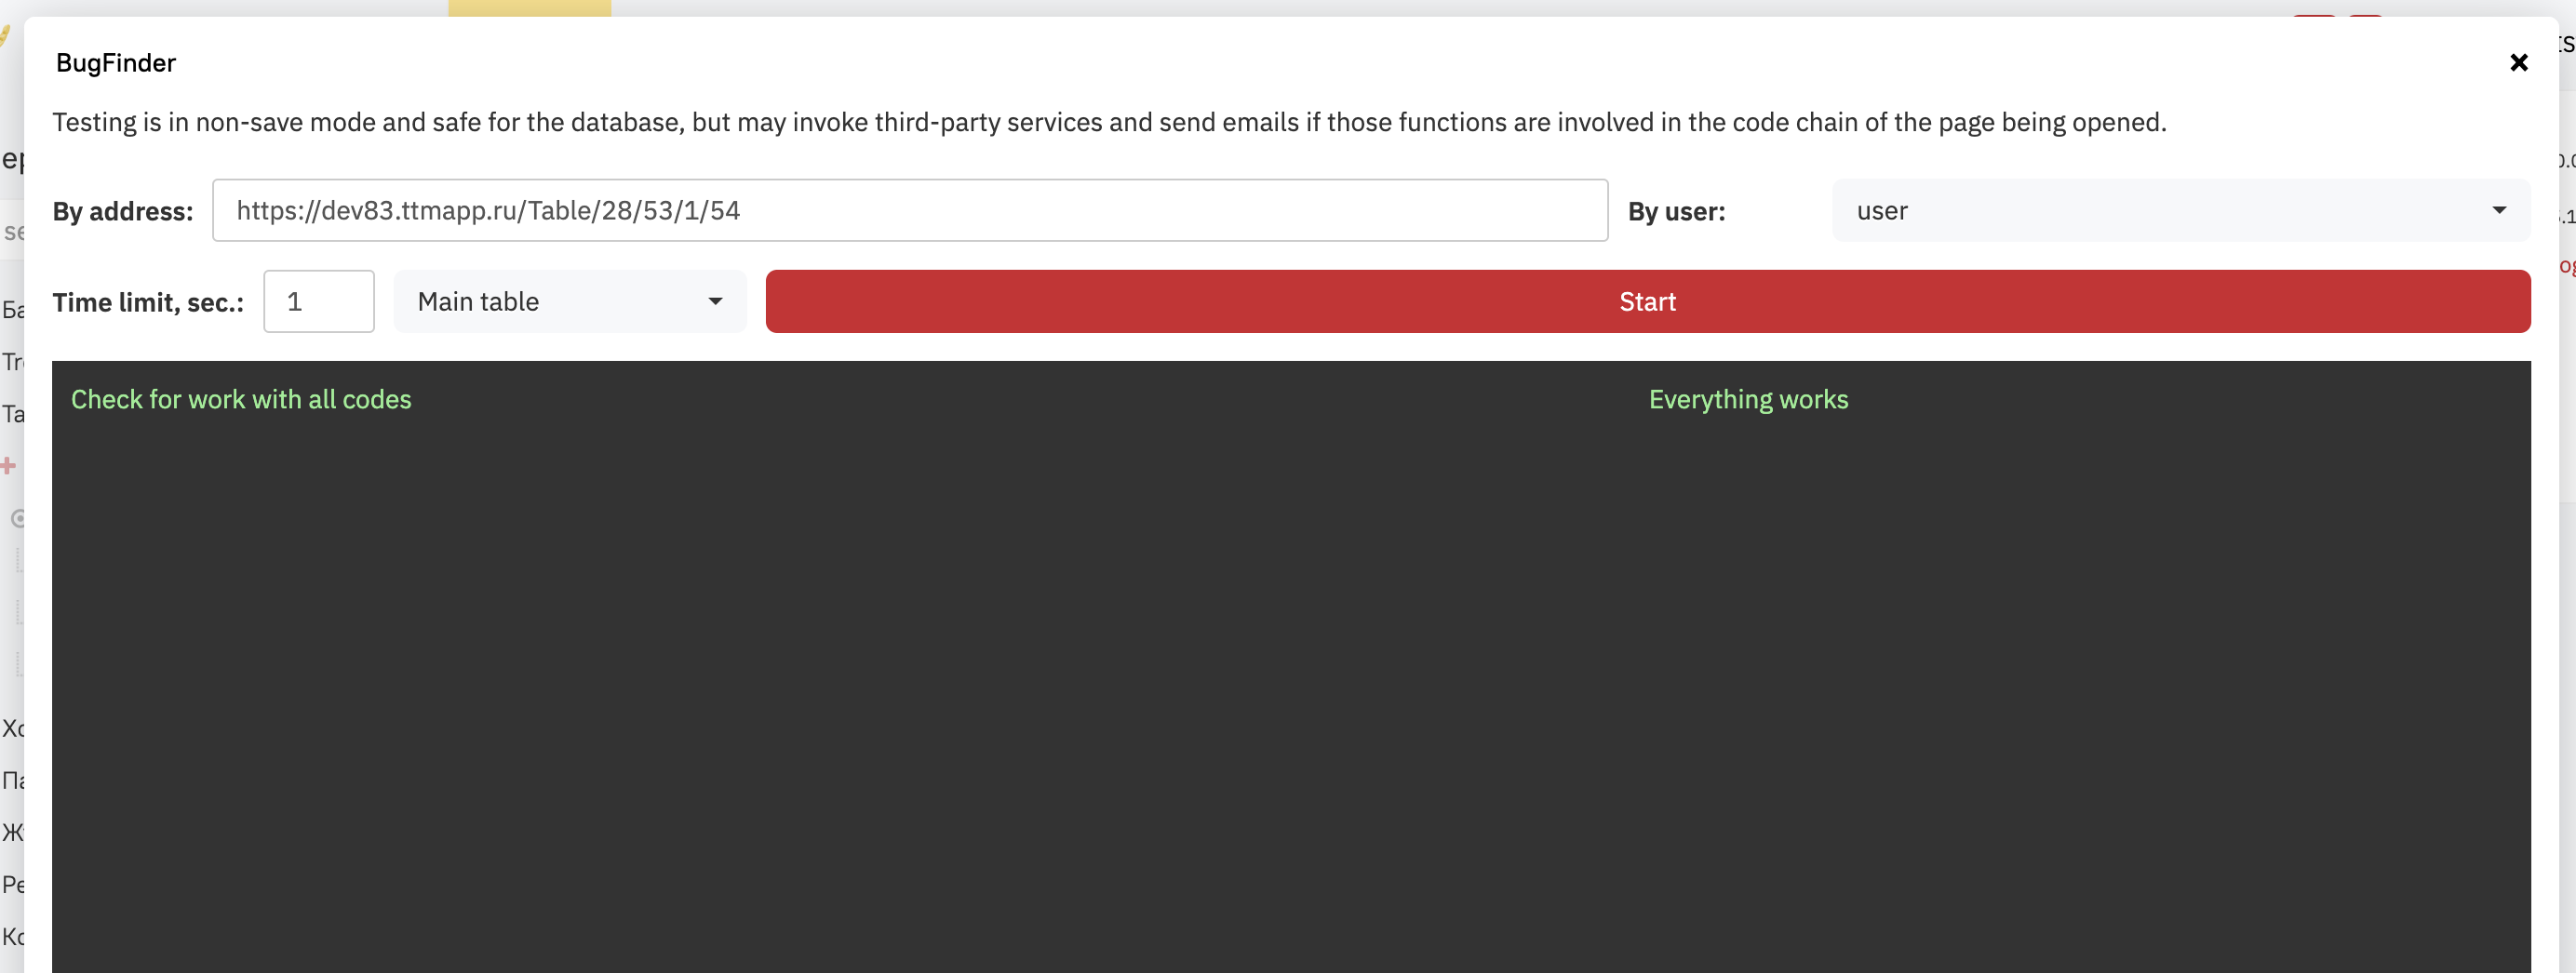
Path — specify the full path to the erroneous table.
User — select the user from whom to perform the check.
Limit — the limit in seconds per iteration. It overrides the standard script execution time limit for the database to avoid long waits. The default is 1 second. You need to set it according to real conditions.
Main Table or Page — for tables that have pagination, you need to check both!
After specifying the parameters, click Start.
The check is carried out as follows: The table is launched with all codes. If code 200 is not obtained within the limit, formatting codes, actions, and codes are sequentially disabled to find the problematic point.
After this, the field in which the error occurs is searched for.