PRO Load Profiling
The task of the Profiler is to identify actions that load the system. When enabled, every action in the system is recorded in a special table with the process parameters.
It is also possible to record processes that had a start point but no end point because they ended with an error.
! Do not enable unless necessary. The Profiler itself generates a significant load and a large volume of technical data in the database.
Activation
In the settings table, in the h_pro_profiling field, you need to specify the following array:
{
  "on": false,
  "withNotif": false,
  "withBroken": false,
  "withErrors": false
}
Set true for on and for the specific options you want to record.
on — general switch for profile recording activity.
withNotif — track notification processes and table update notifications.
withBroken — include data on
phperrors.withErrors — save with fatals. In this mode, it first creates a row and updates it upon completion, adding the end time. When
false, it only writes upon process completion.
Reading
Results are read through the ttm__profiling table. Set the search parameters and download the data using the h_get_data button.
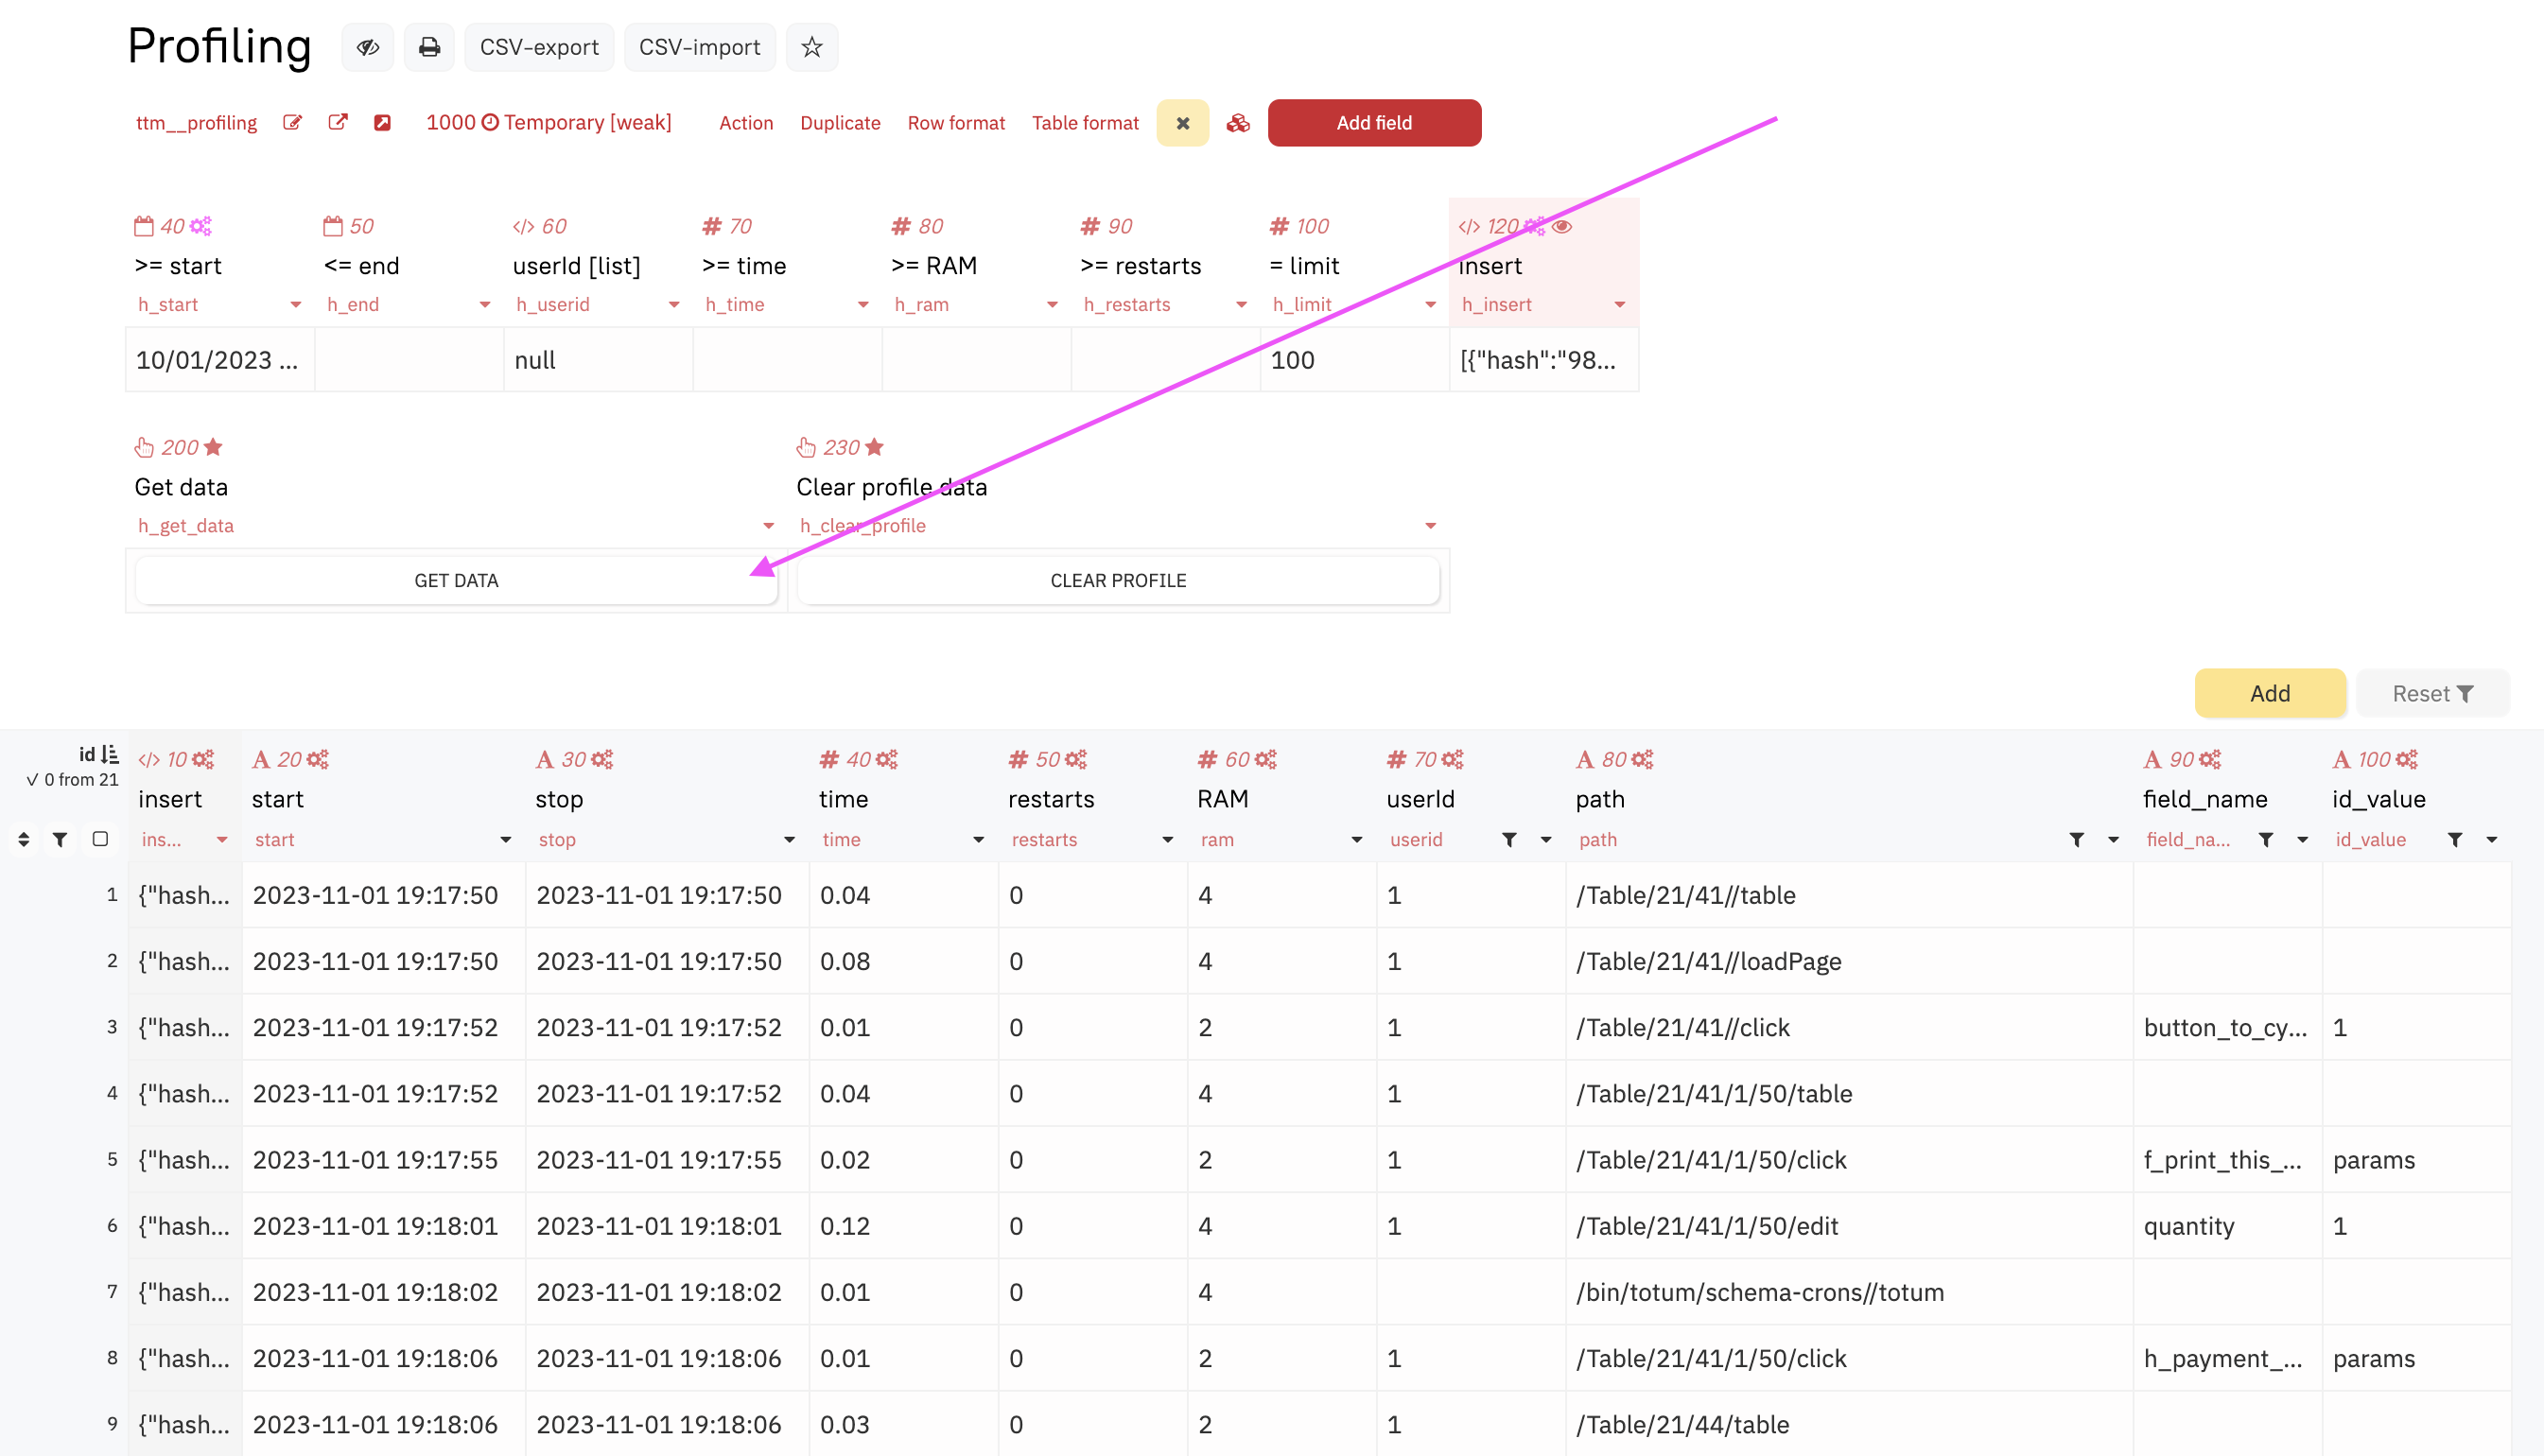
The
h_clear_profilebutton deletes all saved profiling data to clean the database!
Tracked Parameters
start — process start time.
stop — end time. If the process could not complete due to a timeout, this will be empty (requires
withErrorsto be enabled).time — the difference between the start and end times.
restarts — the number of process restarts due to concurrent access errors. If you see many restarted processes, it means the wrong architecture was chosen, and you need to track the table where the conflicting restart occurs and redesign it with the ability to set Relevance to No Tracking.
ram — the amount of PHP process memory used. PostgreSQL memory usage is not logged here.
userid — the id of the user who started the process.
path — the path to the table where the process start point is located.
/Table/21/41/1/50/table— table loading without pagination./Table/21/41//table— table header loading with pagination./Table/21/41//loadPage— row part loading in the table with pagination./Table/21/41/6/50/getValue— loading the full value of a field opened in a window./Table/21/41/6/50/checkInsertRow— processing the addition row./Table/21/41/6/50/loadPreviewHtml— generating HTML preview for Selects./Table/21/41/6/50/add— adding a row./Table/21/41/6/50/refresh— refreshing the table./Table/21/42/loadTreeRows— loading tree-view display./Table/1/6/edit— changing a field value./Table/21/41/6/50//delete— deleting a row./Table/0/1/getTableData— changing a field by the Administrator./Table/21/43/fileVersions— opening file versions./Table/21/43/checkEditRow— opening and changing the panel./Table/21/43/saveEditRow— saving the panel....— and other options./Remotes/flood/table— triggering a Remote.floodis the name of the remote./bin/totum/schema-crons//totum— starting the cron management super-process./bin/totum/schema-cron/1/totum— starting a specific cron.1is theidof the cron.
field_name — the name of the field if the action was started from a field (e.g., action code).
id_value — the id of the row where the action was started. If the action was in a non-row part, it will indicate which part.